Works
6 works online
-
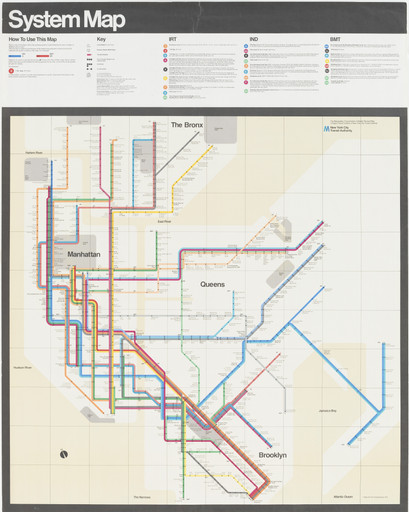
Massimo Vignelli, Joan Charysyn, Bob Noorda, Unimark International Corporation, New York New York Subway Map 1970-1972
-
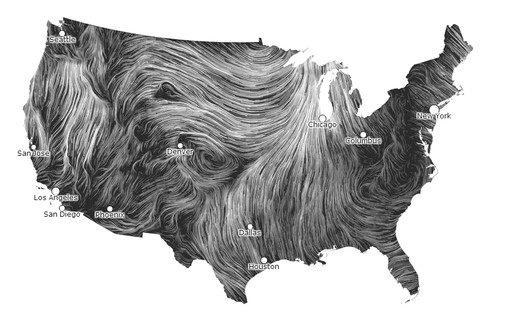
Fernanda Bertini Viégas, Martin Wattenberg Wind Map 2012
-
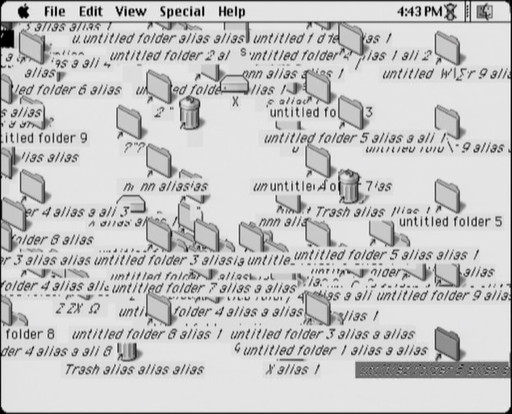
JODI, Joan Heemskerk, Dirk Paesmans My%Desktop 2002
-

Shigetaka Kurita Emoji 1998-1999
-
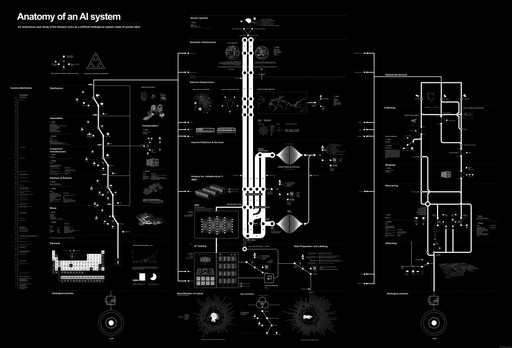
Kate Crawford, Vladan Joler Anatomy of an AI System 2018
-
Ed Hawkins Global Temperature Spiral 2016 (ongoing)