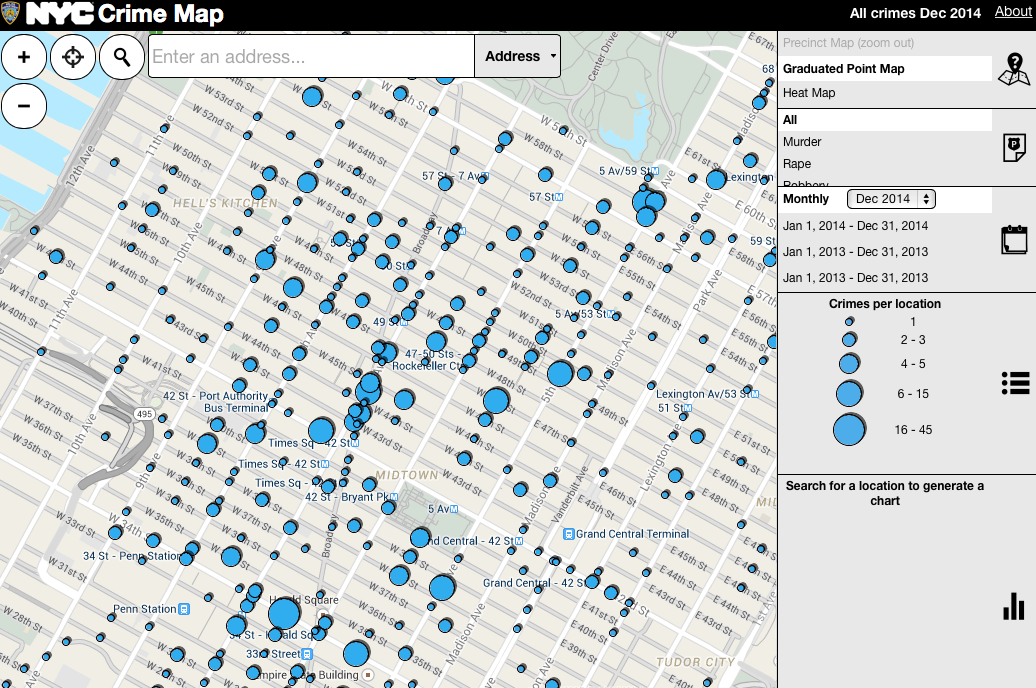
New York City Department of Information Technology and Telecommunications (est. 1994). NYC Crime Map. 2013. Google Maps Java Script API V3, google.maps.visualization, HeatmapLayerOptions, New York Police Department crime data. Image courtesy the Department of Information Technology and Telecommunications, New York City
New York City Crime Map (New York City Department of Information Technology and Telecommunications)
From the curators: Almost every murder, rape, robbery, felony assault, burglary, or act of grand larceny recorded by the New York Police Department (NYPD) ends up–since its debut in 2013–visualized in the New York City Crime Map. Designed by the Department of Information Technology and Telecommunications (DoITT), this map is one of many similar cartographic projects that geographically pinpoint certain illegal, often violent, and sometimes fatal acts. The NYPD estimates that 97% of these types of crimes can be located to an exact address, allowing the public to trace instances of criminal activity to a single intersection or city block. A strategy for crime prevention, consciousness raising, and local goverment transparency, crime mapping allows local law enforcement to visualize and respond to aggregated crime data, identifying patterns or contentious areas in the city. But what do the points on such maps mean for victims of these felonies? While crime mapping is an important factor in preventative policing, can data visualization engage with the harmful aftermath of crime and the damaging ripple effects created in communities?
Save Our Streets (S.O.S.) is a community-based program that uses a public health approach to reduce gun violence at the hyper-local level. The model requires the use of “credible messengers” who have personal experience on both sides of the gun and can work to change the thinking and behavior of potential perpetrators of gun violence. S.O.S. is based on the Cure Violence model, founded by the epidemiologist Gary Slutkin. This model was inspired, in part, by a map: Dr. Slutkin saw a map of gun violence in Chicago, and was reminded of maps of cholera outbreaks in West Africa.
At S.O.S. Crown Heights, we use maps to determine where our staff members should focus their efforts. In addition to tracking acts of violence, we also try to document positive neighborhood resources. For one project last year, we tracked individual acts of kindness using the hashtag #Kindheights on social media. We thought a map of kindness viewed alongside the crime maps might paint a fuller picture of our neighborhood.
While crime maps are useful for allocating resources, they do not tell the full story. The typical crime map says nothing about the impact of crime on residents, or the collateral consequences of crime for neighborhoods. Some of the maps found here or the visual mapping of gun deaths here speak to the emotional impact of loss.
I’m the director of the Crown Heights Community Mediation Center and the founder of S.O.S. Crown Heights and Bedford-Stuyvesant. I spoke with Derick Scott, part of the team responsible for implementing S.O.S. Crown Heights, who currently supervises outreach for S.O.S. Bed-Stuy. Derick was incarcerated for 11 years.
Amy: What perspective do you bring to looking at this map? How does your personal lens affect the way that you interpret this map?
Derick: Years ago, when I was still involved in crime, and robbing drug dealers, I would have used this map to figure out my next spot. I would look at where there was a lot of activity taking place, specifically drug dealing, and know where to go.
Amy: Looking at the map now that you have changed, what do you see?
Derick: A lot of crime. People say crime is going down, and when you think about that, and look at the map, you ask, “Has it?” Because there’s a lot of crime-filled areas. There is a lot of dots. There is no emotion. There is just dots.
Amy: For me, while the map is useful for thinking about tactics and numbers, the map doesn’t tell the story of all the loss the neighborhood and the residents experience due to the crime. The map seems sanitized and unemotional.
Derick: There is no emotion, that’s right. There’s no emotion.
Amy: Do you feel that this map tells the story of your experience?
Derick: No, I can say with absolute certainty that it does not tell the story of my experience. But it does explain why S.O.S. is needed.
Amy: Some of these dots represent lives lost, including people you know personally. What kind of map would you make to represent the emotional impact of these losses?
Derick: If you were going to put dots, I would put colors. Black to represent death, red to represent bloodshed. I would use colors to represent shooting victims. For some strange reason, colors bring forth emotions. When you see colors, you say, “Wow, that’s a lot of death.”
Amy: If you made your own map, what else would you show?
Derick: I’d show safe zones: where churches are, schools, and organizations such as ours. When a person is looking at a map of crime-filled areas, they are also looking for a “back door,” a place they can run to. They want to feel some type of security.
Amy: How could we create a map that showed the impact of these gun violence incidents beyond the individuals who are directly affected? What about the witnesses? The people who hear the shots? The friends of the victims and the parents and siblings of the perpetrators?
Derick: Wow, that would be a lot of colors. That would be too full. Alternatively, you could put numbers inside of the colored circles so that people know how many people were involved.
Amy: You may know some of the people who committed some of these crimes. What do you think they would say if they were looking at this map?
Derick: There are some guys who would say, “Damn, that’s a lot of crime, something needs to change.” Some people would look at it and say that they’ve been putting in work. If you have a story with the map, it’s more useful.
Amy: What do you mean by “putting in work?”
Derick: “Putting in work” means that they did the crime. They are the ones who did the shootings and did the crimes. The dots are what they have created.
Amy: This map only shows seven major crimes. How do you think the map might change if we show white-collar crimes?
Derick: White-collar crimes are things like counterfeit money, credit card scams, money orders (that’s big right now).
Amy: Well, what about corporate crime, like insider trading and market manipulation and crimes that pose a significant threat to the welfare of the community?
Derick: Amy, that would be a whole other map!
Amy: Okay, tell me a bit about what you know about the people who are committing the crimes on this map.
Derick: It’s a lot of younger guys that have a mindset [where] they’re trying to mock the people that came before them. They hear about hood legends and they try to take it to the next level. I’m fortunate enough to have met my children before they were too far gone into the streets but they were hearing these things about my past. When they’re always hearing, “Wow, you look like your dad. Your dad did this. Your dad did that,” they could be trying to do something like what I was doing, but worse.
Amy: What it sounds like to me is that we should be trying to create new, positive hood legends. Each of these dots represents the journey of a hood legend. So with the kindness map, we could create a new story of positivity.
Derick: Years ago, it wasn’t the hood. It was a neighborhood. I couldn’t walk down the street without someone telling me to pull my pants up. Things have changed for the worse. People share their hood legends that glorify and repeat the cycle of violence but what we want to do at S.O.S. is, first, remove these dots, and then tell new stories about the people who prevent and stop the violence.
February 13, 2015, 4:17 am
Lucas Van Lenten
Data visualization as a constructive, community-relevant tool.
The map as an online resource would let citizens ‘explore the dots’ – click a dot and the faces and personal stories of the victims and/or crime are revealed. But that still may be too tech-based to engage community as a whole. I like the idea of color coding, or maybe even symbols to indicate whether a gun was used, the age of the victims. etc. You have to humanize the data. I see a block party, with a huge, neighborhood-centric version of the map projected on the side of a building. Kind of harsh, but then so is violent crime.
February 13, 2015, 6:19 am
Raphael Sperry
The negative is well-known, focus on the positive
People who live in a high-crime area already know it; they probably don’t need a data visualization to tell them much more. The enforcers and reporters don’t need to spend more time with this data as much as they need to understand an empathize with the people and the dynamics in high-crime areas. I think the “kindness map” that Amy mentions, or more generally the “asset mapping” approaches within urban planning, can be more helpful. They can help outsiders see the value in distressed neighborhoods and potentially create a tool to help those positive seeds to grow.
February 15, 2015, 3:16 pm
Kate Krontiris
Taking a networked approach
What if this data could tell a story about networks and relationships among actors in a neighborhood? We know that gun violence spreads through social networks, but this visualization make it seem like these are isolated, atomic incidents. It would be awesome to be able to see who is responsible for a set of crimes, or has relationships with others responsible for their own crimes. In any given neighborhood, are we talking about 12 people who commit many incidents, or are we talking about hundreds of people who commit 1-2 crimes? How, if at all, are these individuals linked to each other? Relatedly, we might take a networked approach to asset-mapping, safe-space mapping, or social capital mapping in the neighborhood. If we can visualize these networks, we may have a better sense of how to disrupt (or reinforce) key nodes.
February 16, 2015, 8:24 pm
Shane Wang
Visualized Data Can Be Misleading
I think mapping violence is a good idea, when done right, it gives a clear visual indication of the safety level in a given neighborhood. However, graphs like this are often a simplification of something much more complicated and thus can become misleading and misread especially by people who fail to analyze the data in depth. For example, the map uses a straightforward dotting system that graphically display the occurrence of criminal activities ranging from theft to felony in a given time period, but what’s left out is the time of occurrence, reason of occurrence, etc. Data like this also requires a long term of record to prove a pattern, so i don’t think it has much real use in terms of determining safety. The route I’ve always taken to reach home (14th st) seems rather dangerous and filled with big dots at every other block, but I’ve never noticed any crimes myself in the three years i’ve been taking it, so I find it very inaccurate, but it makes sense because my minor insignificant personal experience also has no relevance to the grand data in big scale.
February 19, 2015, 5:01 pm
Maria
You have some great ideas. Where is the link to the kindness map?
February 22, 2015, 1:52 pm
Stephanie Skaff
The Big Picture
This is a fascinating conversation, thinking of all the impacts that are not gathered by statistics. Raw crime stats don’t tell a story, and a story is what can make a change. Stats make policy change and emotions make community change. In order to reduce and prevent gun violence, we need both. Thank you for all your hard work experimenting and making discoveries on behalf of the Crown Heights community.
March 3, 2015, 3:17 pm
Amy Ellenbogen
Project Director, Crown Heights Community Mediation Center
Thanks Maria for your interest! Please follow our social media for updates on the kindness map.
crownheights.org
Facebook: facebook.com/sosbrooklyn
Twitter: twitter.com/SOS_Brooklyn
Instagram: @soscrownheights
March 9, 2015, 2:21 pm
Steph Ueberall
Associate Program Director
It would be great to use the data to inform where more kindness/awareness is needed. For example, after a shooting SOS conducts a shooting response in the location of the shooting to raise awareness and build healthier norms around violence. It would be great to use these data to deploy a team like SOS to create more kindness and awareness in such areas as a method to increase safety for communities. I love Derick’s idea of having a story with the data as well.