Climate Scientist, Ed Hawkins: I think I'm quite a visual learner, and so I like making visualizations of things.
I'm Professor Ed Hawkins. I'm a climate scientist in the UK.
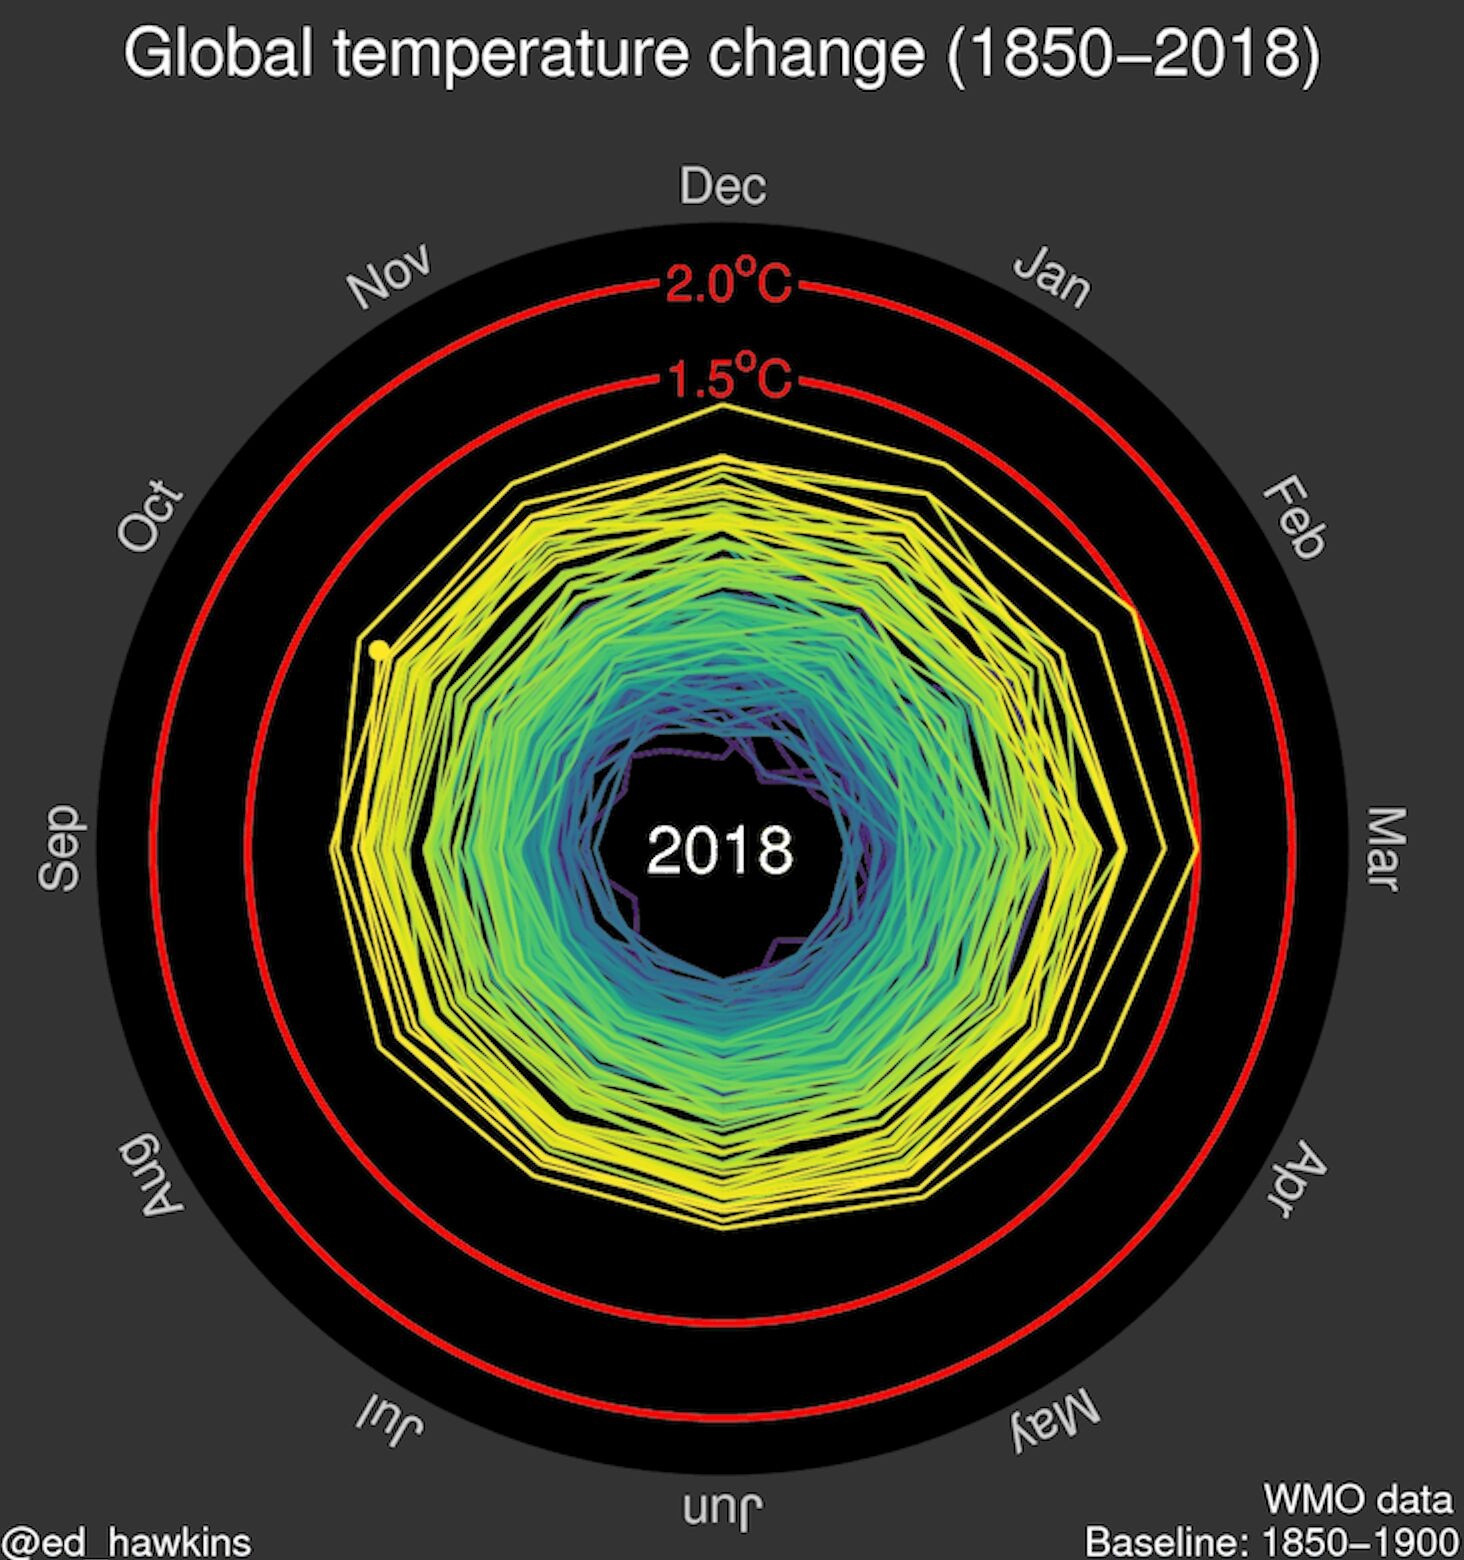
What you're looking at now is the “Global Temperature Spiral,” which I developed in 2016 to show the rapid rise in global temperatures over the last 170 years or so.
Our reliable global temperature records start in about 1850. With the “Global Temperature Spiral,” we see lots of variations in temperature up to about the 1930s or so. After about 1970 is when things really start to accelerate, and we see a very rapid warming up to present day. The reason is purely because of our emissions of carbon dioxide and other greenhouse gases, which act as a warming blanket for the atmosphere. Those changes in temperature cause other things to happen, such as the sea ice and the ice sheets to melt, and we see increased heat waves and heavy rainfall events as well.
I think one of the reasons the animation works is because it tells a story. You're seeing the changes being relatively small to begin with, and you get a sudden surprise at the end when things spiral outwards very rapidly. That surprise makes people watch it again and again and again. I was really rather shocked at the popularity of it. I just put it online and didn't really expect to see anything, and suddenly everyone's messaging me to say how helpful it is.
I chose to study the climate because I understood that it had real impacts on people, and I wanted to do something that had a direct relevance to society. We face enormous risks from the fact that our climate is changing, and we need to take some pretty large actions to respond to those risks, and they need to be well-informed decisions to make the best possible response.