
Front / Recto
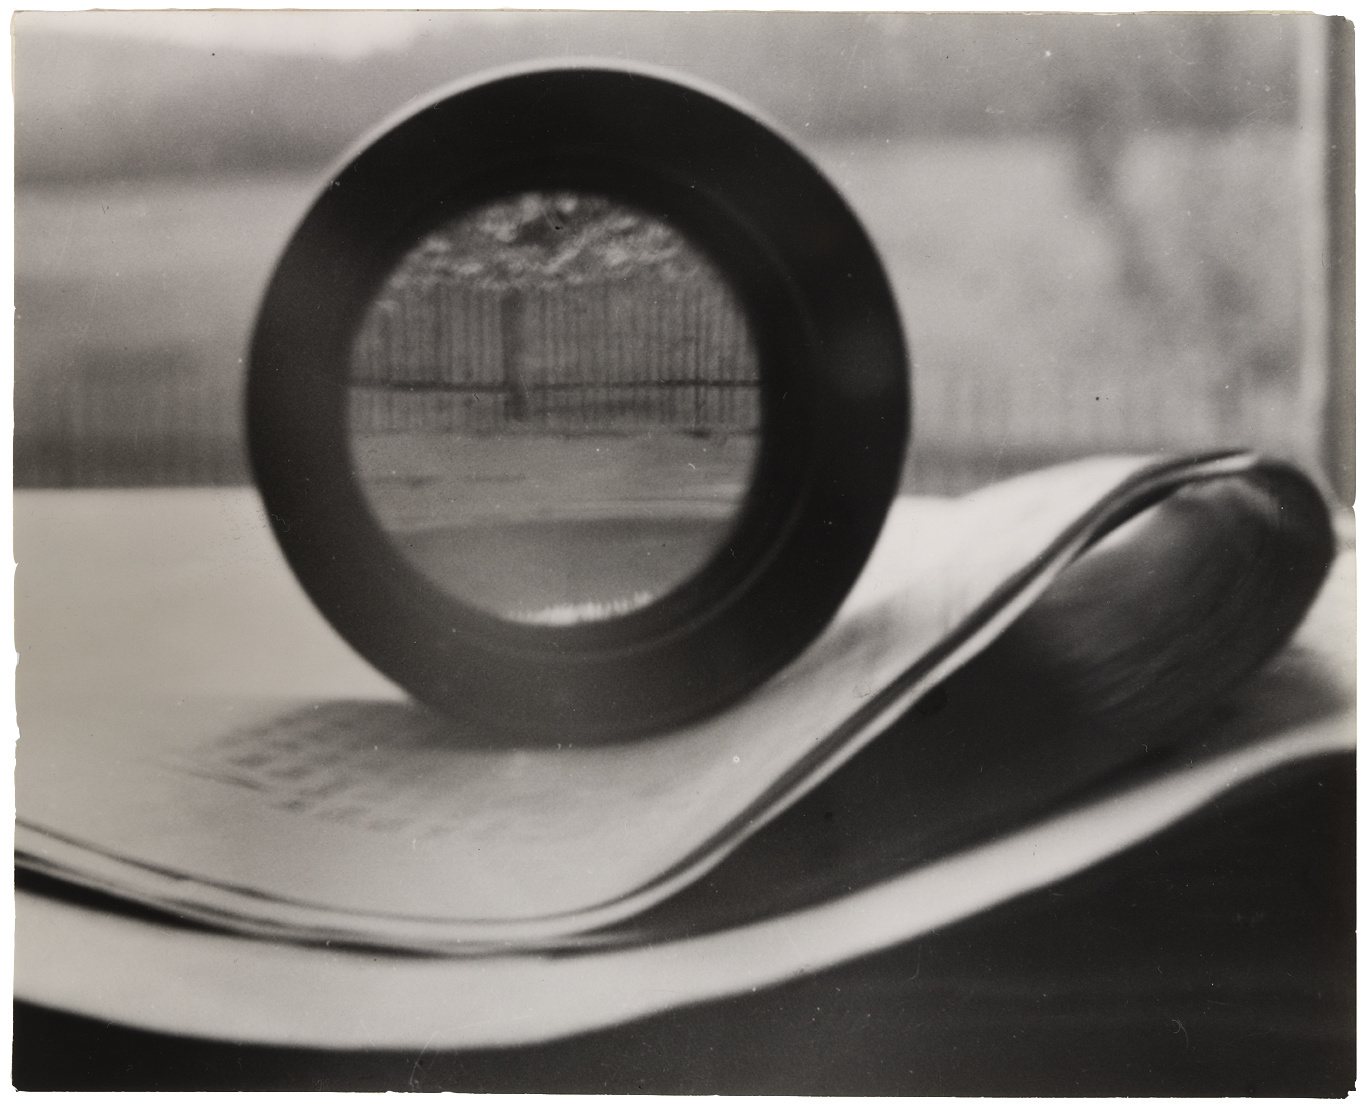
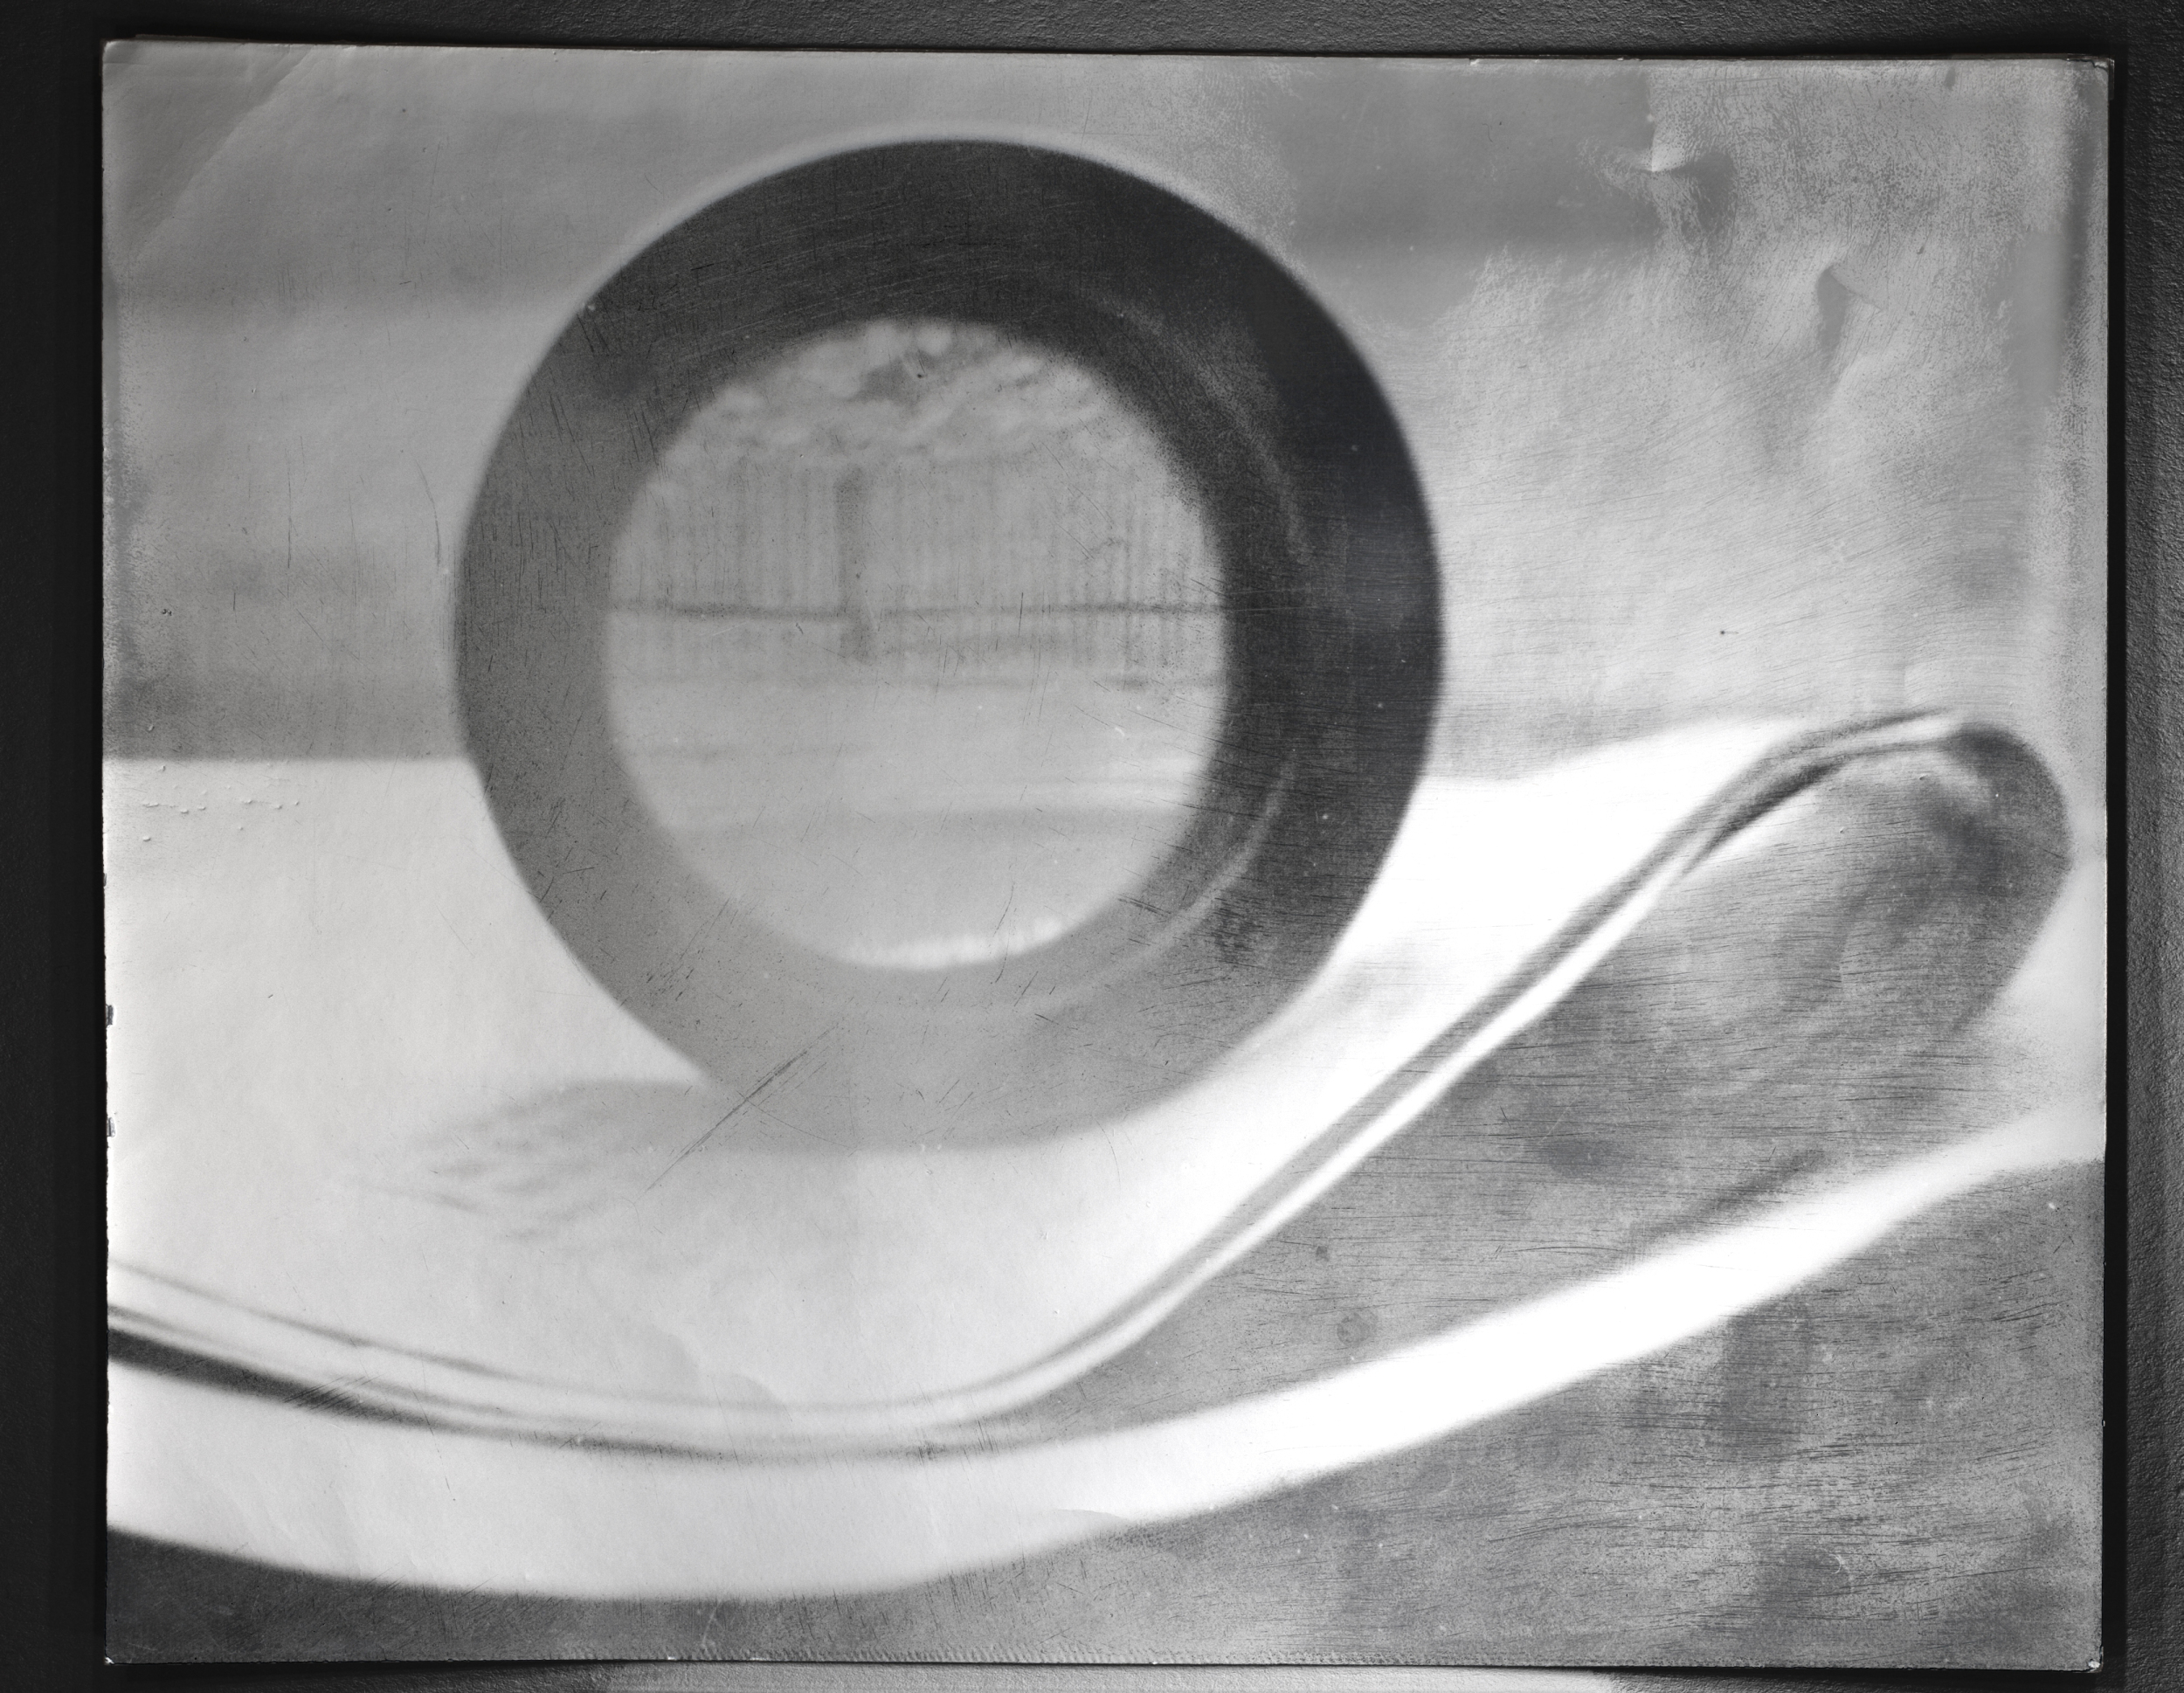
- Title Untitled
- Negative Date c. 1930
- Print Date 1960–70
- Medium Gelatin silver print
- Dimensions Image 7 3/16 × 8 7/8" (18.2 × 22.6 cm)
- Place Taken Slawno
- Credit Line Thomas Walther Collection. Horace W. Goldsmith Fund through Robert B. Menschel
- MoMA Accession Number 1689.2001
- Copyright © 2015 Raoul Hausmann / Artists Rights Society (ARS), New York / ADAGP, Paris
Back / Verso
- Mount Type No mount - evidence previous mount
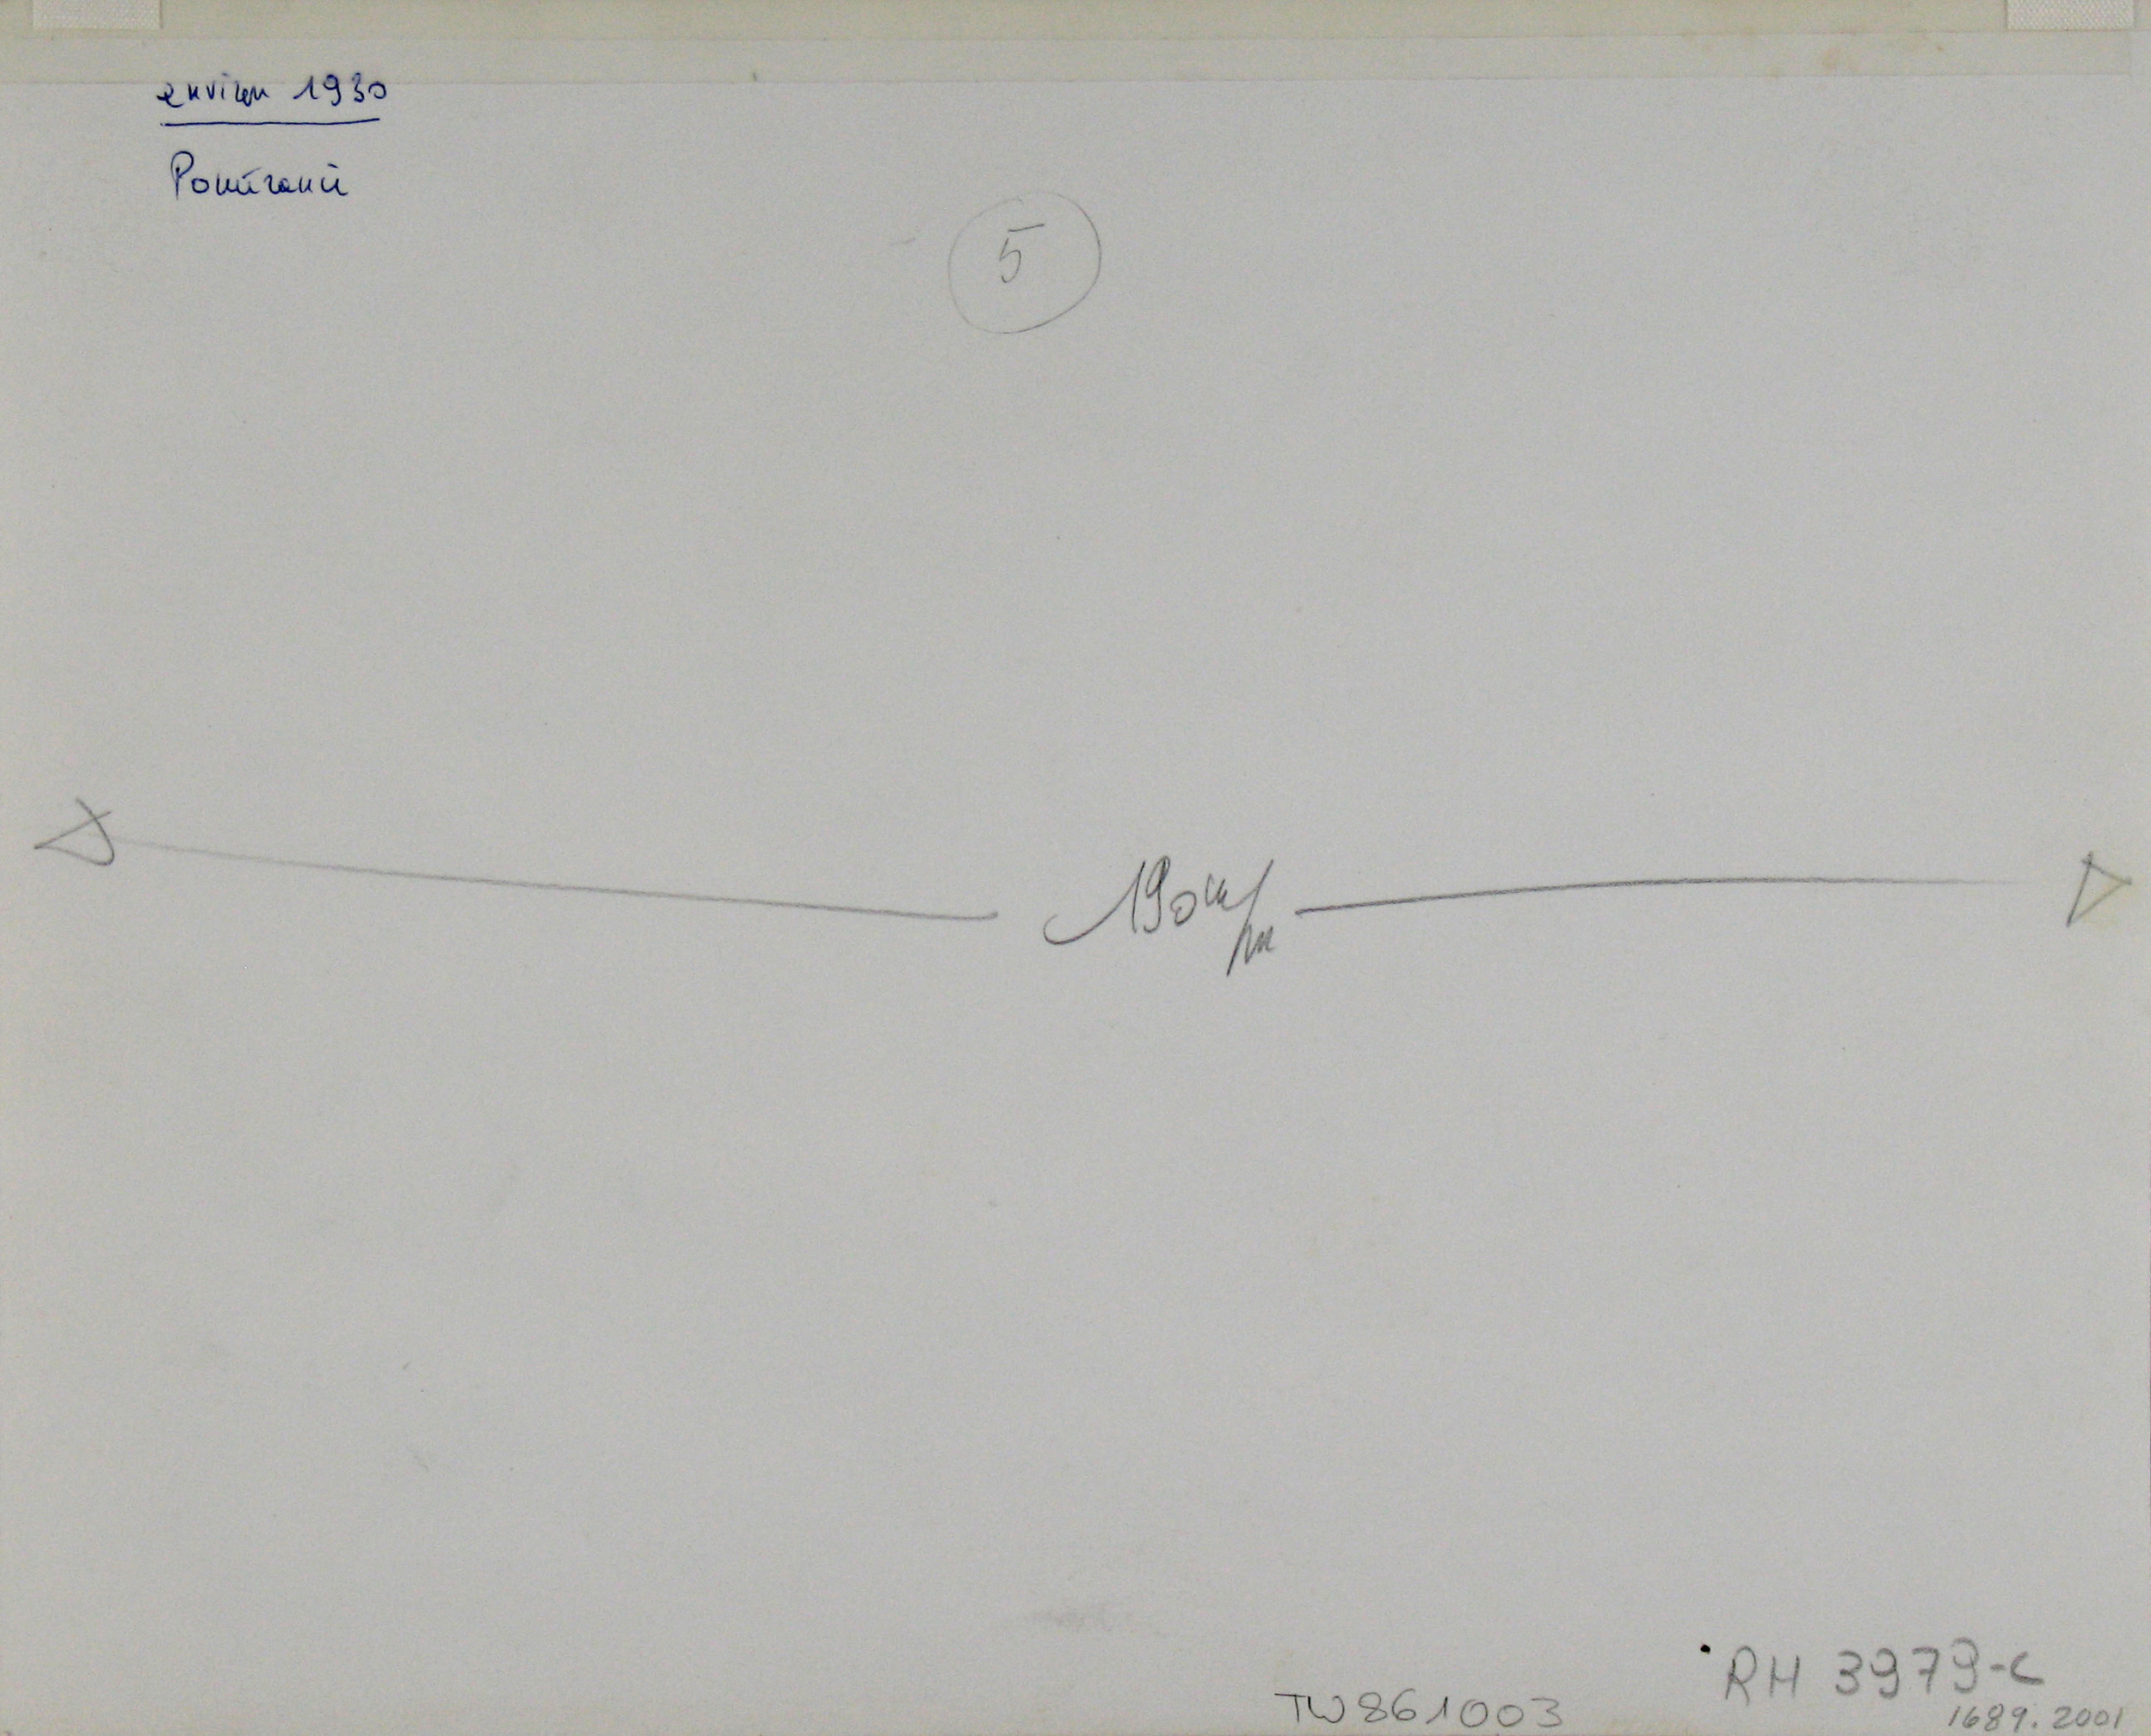
- Marks and Inscriptions Inscribed in blue ink on sheet verso, top left: environ 1930 [underlined]/Pomérania. Inscribed in pencil on sheet verso, top center: 5 [circled]. Inscribed in pencil on sheet verso, center: ←190 m/m →. Inscribed in pencil on sheet verso, bottom right: TW 861003. Inscribed in pencil on sheet verso, bottom right: RH 3979-C.
-
Provenance
The artist. Probably Cornelia Frenkel, Freiburg, Germany [1]; purchased by Thomas Walther, possibly October 1986 [2]; purchased by The Museum of Modern Art, New York, 2001.
[1] MacGill/Walther 2001(3), p. 8.
[2] Ibid.; and Thomas Walther archival no. TW 861003 on sheet verso.
Surface
- Surface Sheen Glossy
- Techniques Ferrotyping Enlargement via lateral projection
-
PTM
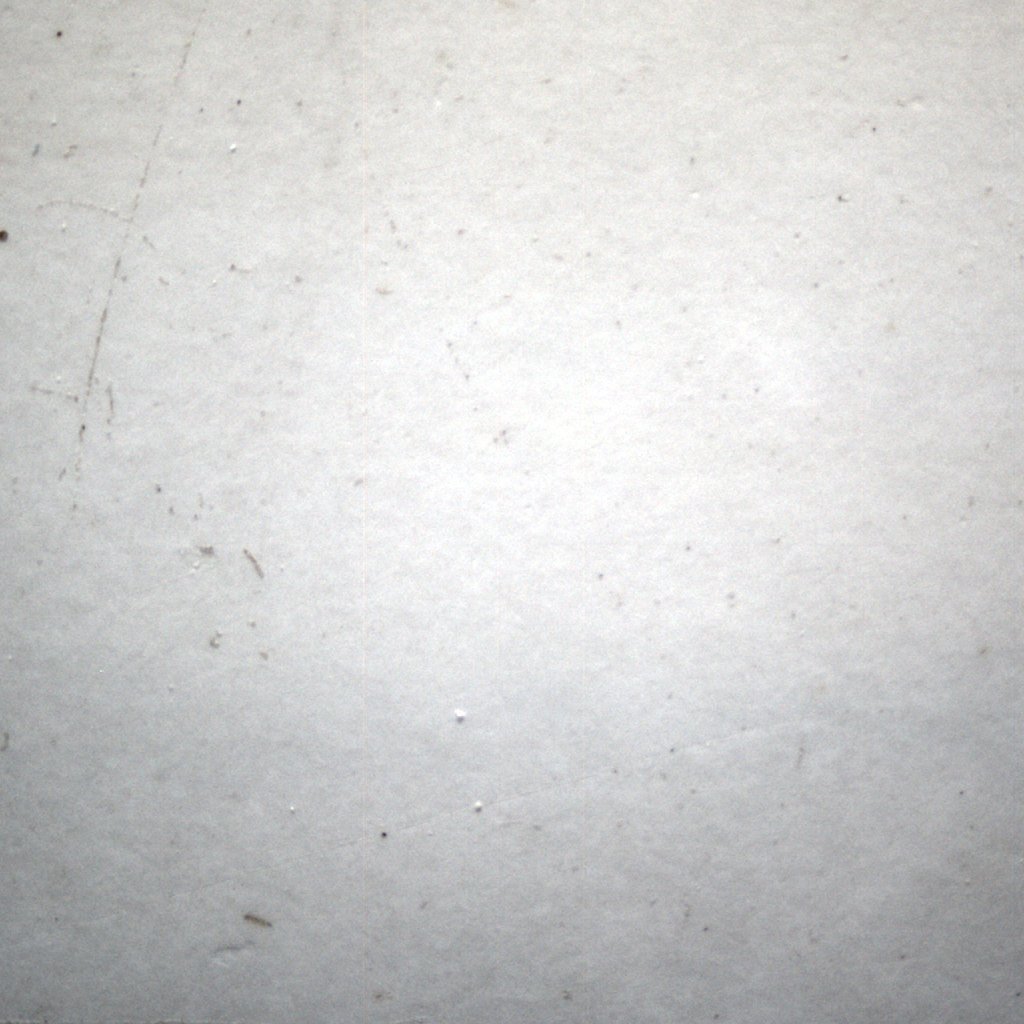
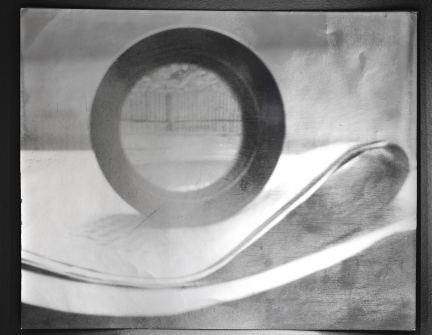 View of the recto of the artwork made using reflectance transformation imaging (RTI) software, which exaggerates subtle surface details and renders the features of the artwork plainly visible. Department of Conservation, MoMA
 -
Micro-raking
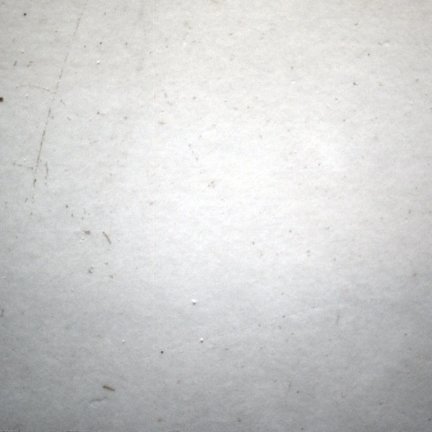 Raking-light close-up image, as shot. Area of detail is 6.7 x 6.7 mm. Department of Conservation, MoMA
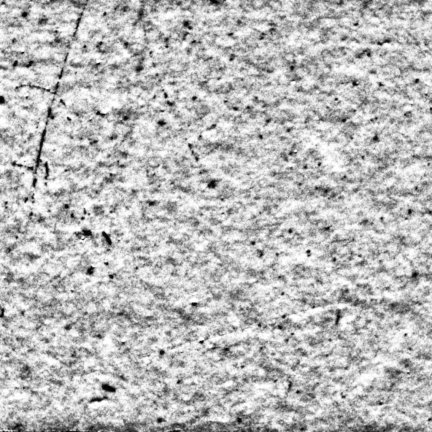 Raking-light close-up image, processed. Processing included removal of color, equalization of the histogram, and sharpening, all designed to enhance visual comparison. Department of Conservation, MoMA

Paper Material
- Format Metric
- Weight Single weight
- Thickness (mm) 0.17
- UV Fluorescence Recto positive Verso positive
- Fiber Analysis Softwood bleached sulfite 77% Hardwood bleached sulfite 23%
- Material Techniques Developing-out paper
-
XRF
This work was determined to be a gelatin silver print via X-ray fluorescence (XRF) spectrometry.
The following elements have been positively identified in the work, through XRF readings taken from its recto and verso (or from the mount, where the verso was not accessible):
- Recto: P, S, Ca, Zn, Sr, Ag, Ba
- Verso: Al, P, S, Ca, Zn, Sr, Ba
The graphs below show XRF spectra for three areas on the print: two of the recto—from areas of maximum and minimum image density (Dmax and Dmin)—and one of the verso or mount. The background spectrum represents the contribution of the XRF instrument itself. The first graph shows elements identified through the presence of their characteristic peaks in the lower energy range (0 to 8 keV). The second graph shows elements identified through the presence of their characteristic peaks in the higher energy range (8 to 40 keV).
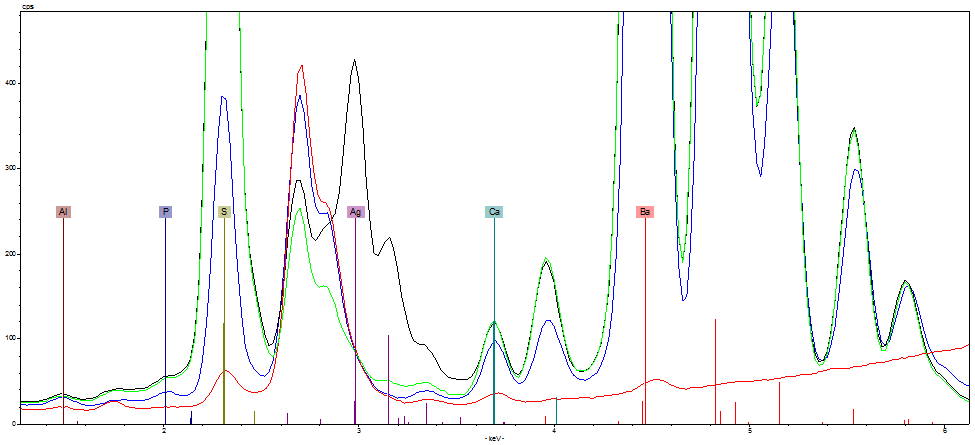 Areas examined: Recto (Dmax: black; Dmin: green), Verso or Mount (blue), Background (red)
Elements identified: Al, P, S, Ca, Ag, Ba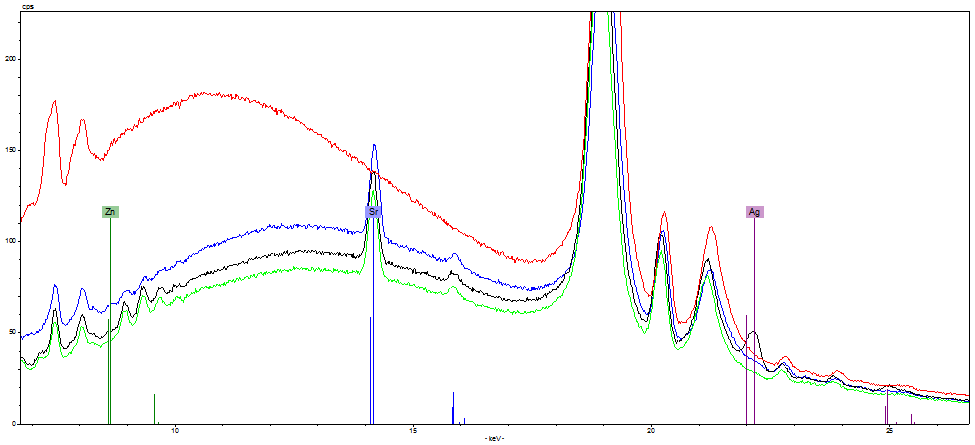 Areas examined: Recto (Dmax: black; Dmin: green), Verso or Mount (blue), Background (red)
Elements identified: Zn, Sr, Ag
In Context
Related People
-
Artist